Join JPI UE
Faq
FAQ
Please click here for the frequently asked questions we collected.
If you have an additional questions you are welcome to mail us at info@jpi-urbaneurope.eu
Many cities need to drastically lower their CO2 emissions whilst meeting an ever-growing demand for carbon intensive resources. The M-NEX (Movable Nexus) project argues that by focusing on their food, water, and energy systems (FEW), cities can create circular economies and simultaneously reduce their carbon emissions. We interviewed Professor Wanglin Yan, the project coordinator for M-NEX, about the methodology and tools they developed.
The M-NEX project has created an innovative metric to measure the CO2 emission from FEW systems down to the neighbourhood level, overcoming a limitation of existing tools. The project built from an existing measurement system and adjusted it to consider the physical land area to meet the demand for FEW and the possible land area needed to create new space to supply FEW locally, as well as the forested area required to absorb CO2 emissions through the process. They call the system the ‘FEWprint’.
The main purpose of creating the FEWprint was to provide a key performance indicator that policymakers could use to see precisely where the local potential for food, energy and water production was in order to reduce CO2 emission. If policymakers know where the highest demand for food, water, and energy are, then they can decide where to generate resources such as green energy, green buildings, and urban agriculture. By the Autumn of 2021, the project will have uploaded a designer’s evaluation tool for calculating FEW prints within a city. It will be fully operational and open source, so it can easily be used by anyone. Wanglin adds, “there are actually many tools that have been reviewed in our project, we are sure this is a unique on to help urban designers and policymakers directly through the process of decision-making.”
“If policymakers knows where the highest demand for food, water, and energy are, they can concentrate on creating resources for green energy, green buildings, and urban agriculture accordingly”
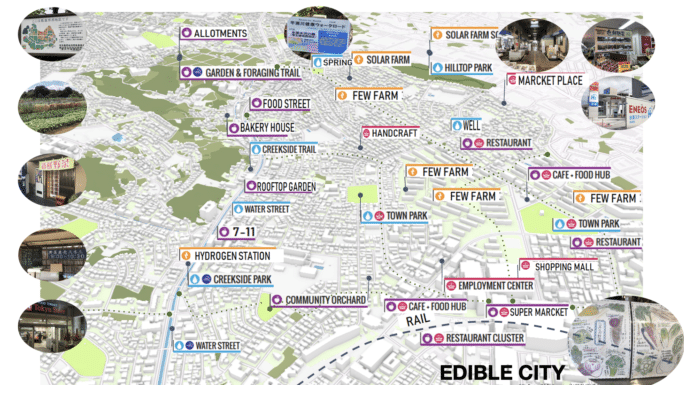
One key finding of the projects is the substantial potential of urban greening to reduce CO2 emissions; this is achieved using urban rooftop gardens and vertical wall greenery on buildings. Efficient use of vacant urban spaces for agricultural purposes could drastically reduce the transportation cost of fruits and vegetables to urban areas, which generally rely on production outside of the city. Even in densely populated areas, rooftop gardens and urban farming offer promising opportunities, particularly when combined with new technologies.
Urban greening and urban agriculture are not just futuristic plans, they are already being put into practice across many cities. Wanglin draws attention to the example of the project’s aquaponic factory in Belfast (aquaponics involves growing plants based in water). The project also collaborates with urban farmers in Doha, who have built semi-underground greenhouses. In Detroit, the project cooperates with NPOs (non-profit organisations) to revitalising urban centres by urban farming. In Groningen, policy makers are currently evaluating the landscape to potentially introduce organic farming.
All these widely varying contexts use some form of urban agriculture, and hence food as an entry point to urban greening. According to the FEWprint calculations driven by the TU Delft team of M-NEX, all of these disparate cases show a reduction of CO2 emissions as a result of implementing urban greening or urban farming.
M-NEX has created a nine-step methodology to help urban policymakers reduce food, energy, and water demand:
The first three steps are all necessary for creating the FEWprint itself, the next three are about concept generation, such as increasing local food growth or creating local water supplies, and the final three steps are all about selling these changes to the local community, starting with the engagement of key stakeholders, such as the municipal government or local businesses using an urban living lab (a collaborative space where experiments can be done in the field and feedback can be gained from the public).
M-NEX has disseminated these findings both online and offline, and they made extensive use of urban living labs. M-NEX built an Actor-network (a visualisation tool that shows key stakeholder relationships and how they contribute to sustainable development), so the project was able to identify and physically bring together those who could benefit the most from M-NEX’s tools and methodology. The M-NEX methodology, literature, reviews, and findings are freely available on the project’s wiki site.
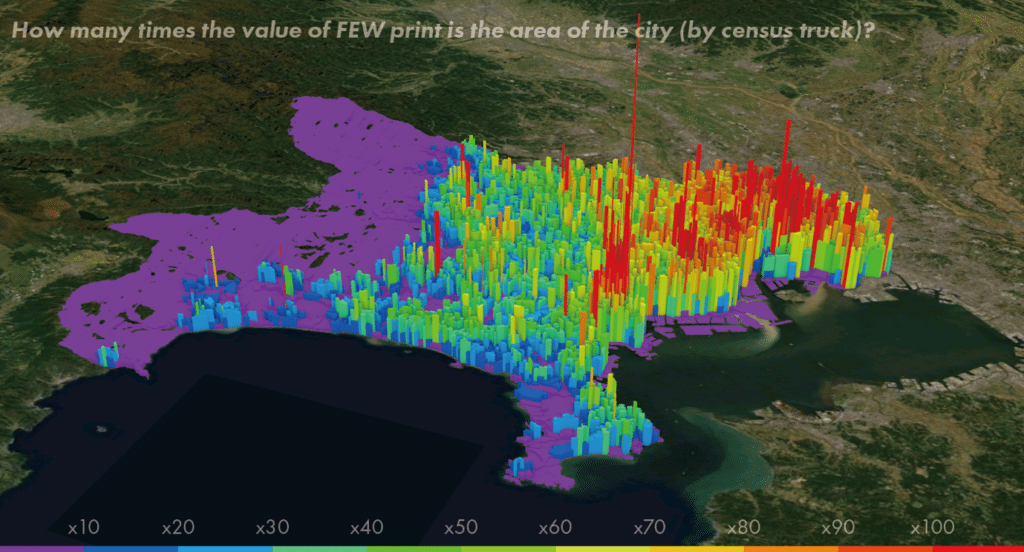
The project has also made GIS visualisations that work along with the FEWprint. Below is a GIS map of Tokyo, produced by the project. The cooler shaded colours represent areas with lower levels of carbon emission, whereas the warmer shaded areas represent areas with higher levels of carbon emission. This instantly gives policymakers a mental topography of carbon emission within their cities, and a relative understanding of where neighbourhoods stand in relation to each other when it comes to CO2 emission. For example, the tallest red bar on the map is the Oimachi area in the Shinagawa ward of Tokyo. Wanglin says, “In this neighbourhood they require more than one hundred times their own space to meet their demand for FEW.”
“This gives policymakers a mental topography of carbon emissions in their cities”
Even if the M-NEX tools are available to everyone, who are the intended users? Wanglin emphasizes the value of collaboration between stakeholders, which was a key feature of the entire project: “Each team was very cooperative. We had young researchers who met every two weeks to develop and use the tool.” However, he expects that governmental actors, urban managers and developers will be the primary users of the M-NEX tools, and they will be using them to meet CO2 reduction commitments: “In Tokyo for example, we have made the commitment to be a zero-emission city by 2050. This tool helps us measure how we are going to do that.” However, private actors such as construction companies and energy suppliers are big players in the M-NEX project, as the tool let them see where their consumers are and where their demand is.
The most ground-breaking aspect of the M-NEX project is precisely the breaking of boundaries between public and private, according to Wanglin. “Many cities are managed by the government, but land is owned privately, and services for food and transport are private. Everything is separated by sector, very silo based. The project offered an opportunity for many of these actors to talk to each other for the first time.”
“In Tokyo for example, we have made the commitment to be a zero-emission city by 2050. This tool helps us measure how we are going to do that.”
In the short run, the project has managed to generate enthusiasm from stakeholders who interacted with the project. In Tokyo, the project has had meetings with the Yokohama city government, real estate companies, industrial actors and developers who have all expressed a desire to use M-NEX’s design methodology and the FEWprint tool.
In terms of long-term impact, the project has generated enough excitement that they can continue to refine and improve their tool. Wanglin says, “Another city lab here in Tokyo, who are an association of planners, told us this is the kind of tool they are looking for to measure the effect of actions. We need more time to evaluate how the tool works, and we intend to further test and improve it over time, through collaboration with our partners.”
This project is supported in the Sustainable Urbanisation Global Initiative (SUGI)/Food-Water-Energy Nexus, jointly established by the Belmont Forum and the JPI Urban Europe.